Professional Bioinformatics Analysis Tools
Choose the right analysis tool to start your research
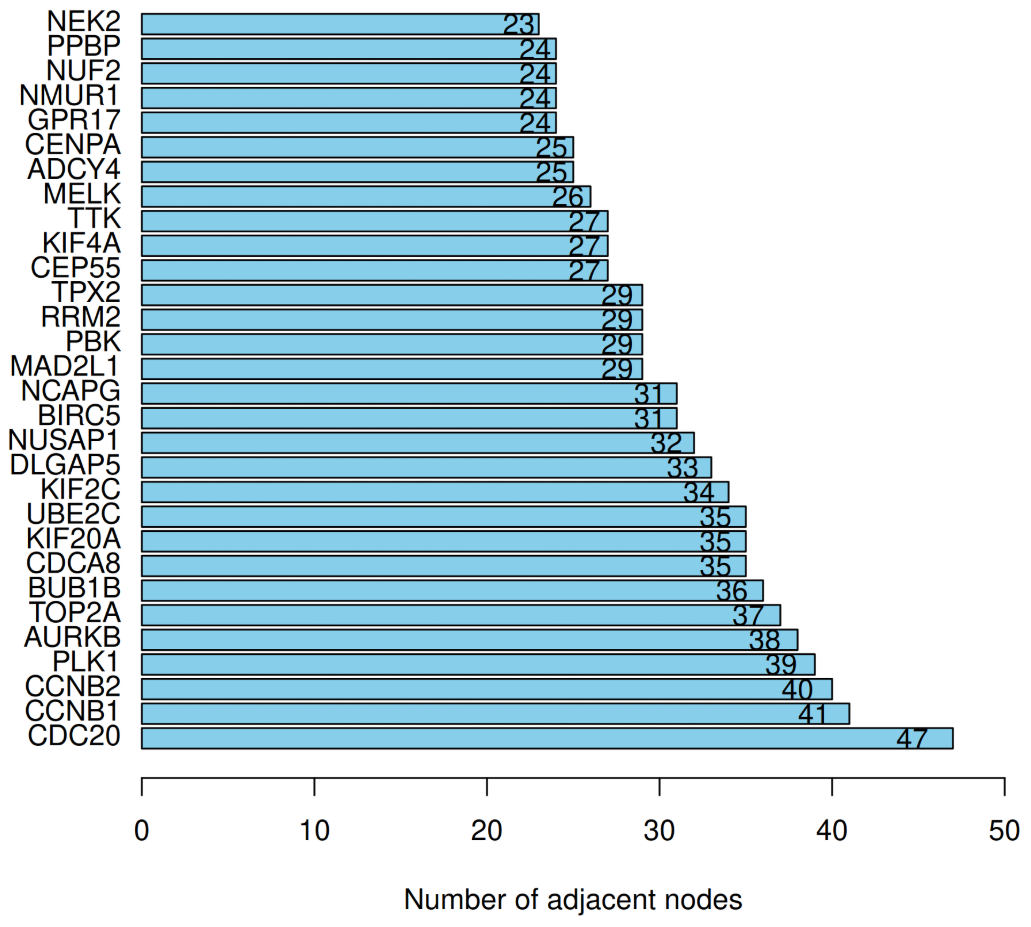
Bar Plot Statistics
Statistical analysis and bar plot visualization for frequency data
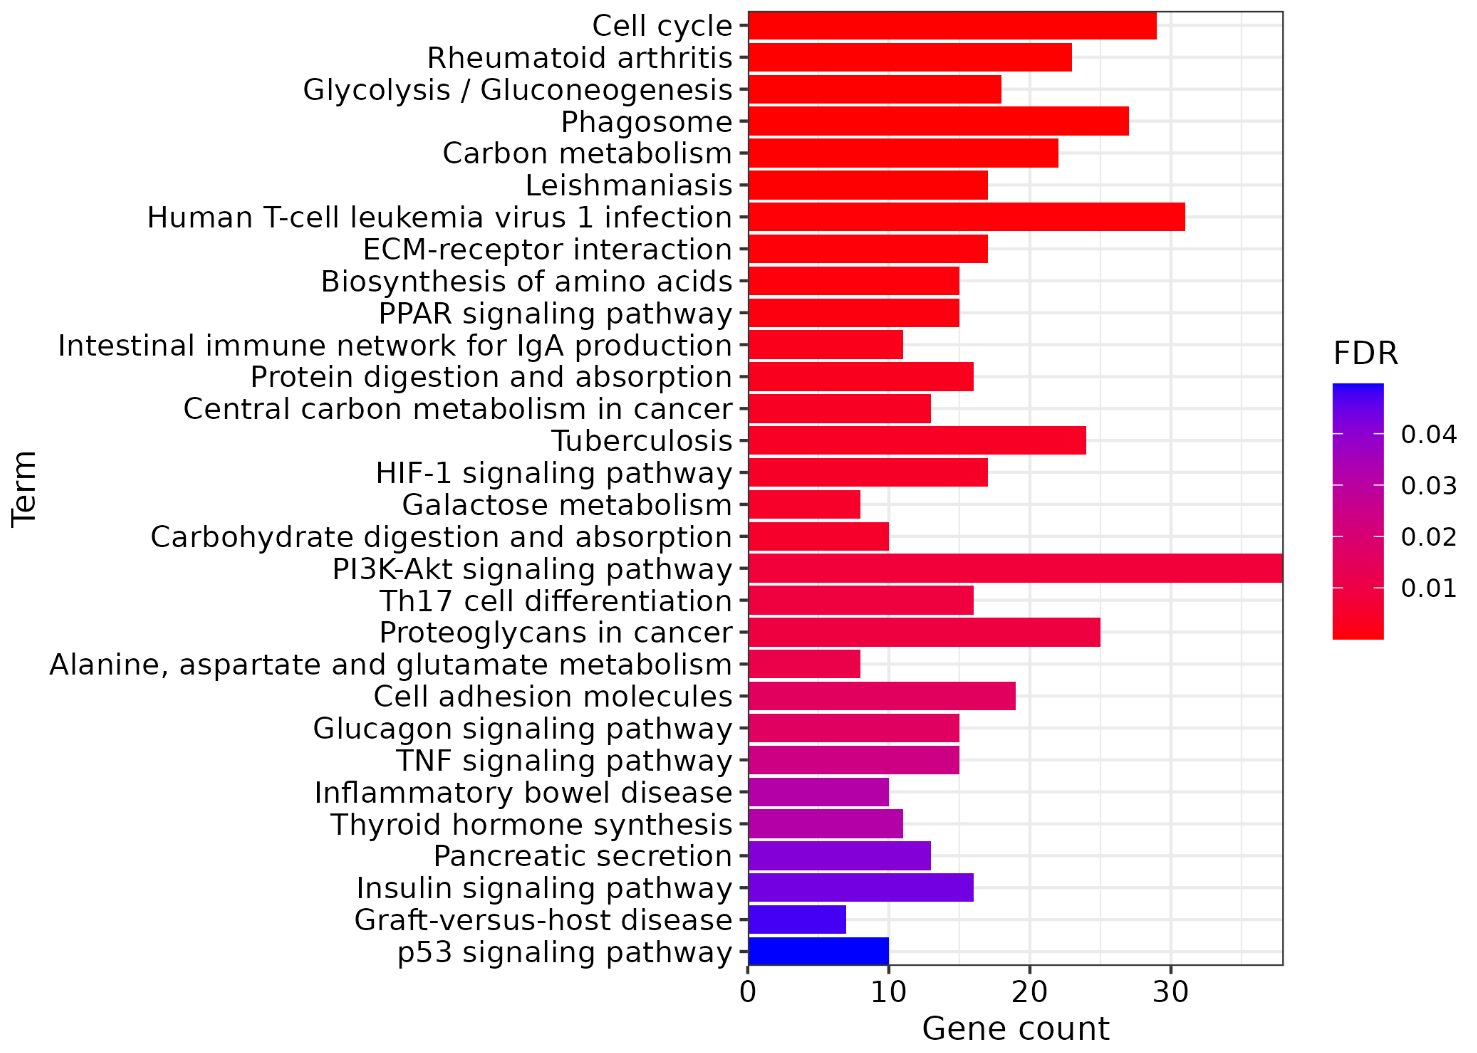
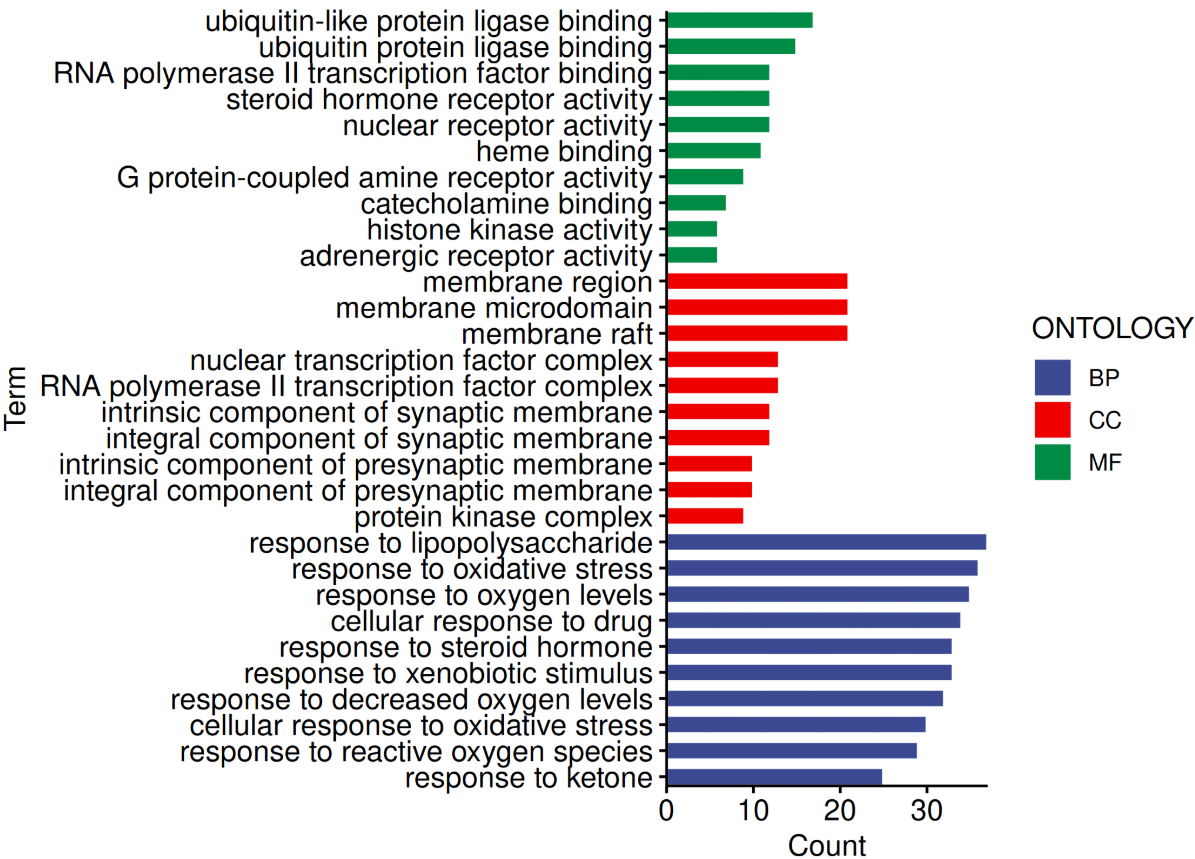
P-value Bar Plot
Bar plot with P-value gradient for enrichment analysis results
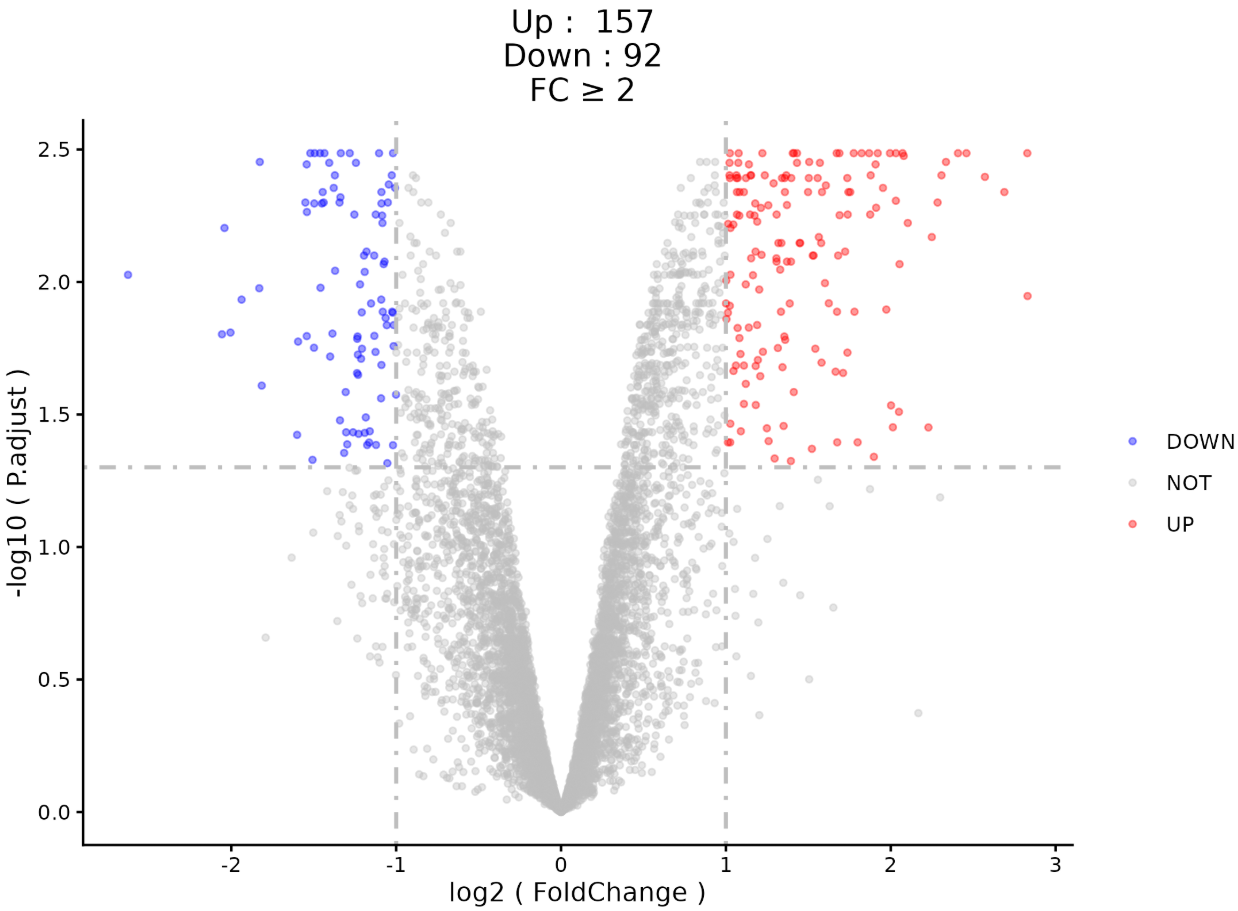
Volcano Plot
Volcano plot for differential expression analysis
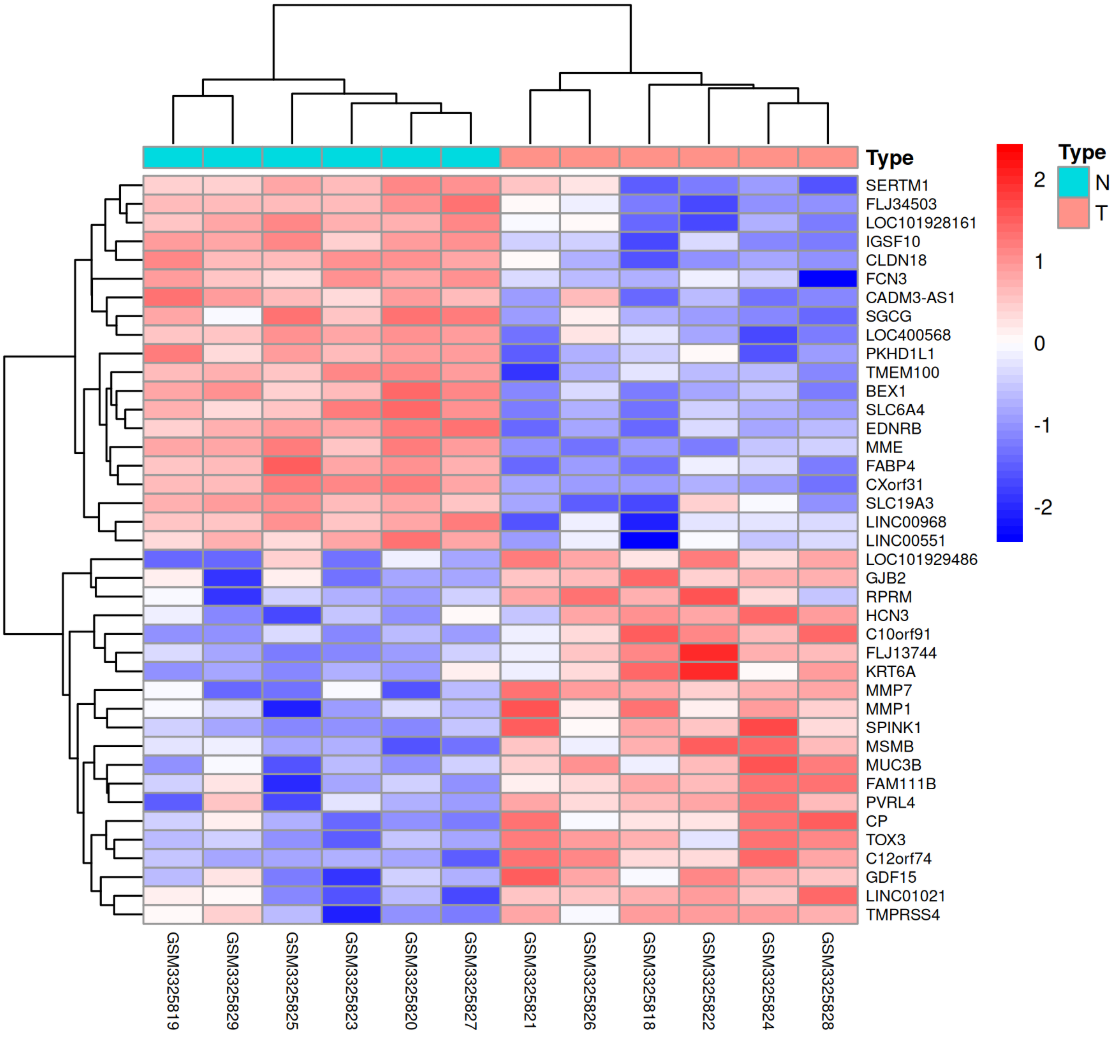
Heatmap
Clustering heatmap for gene expression data
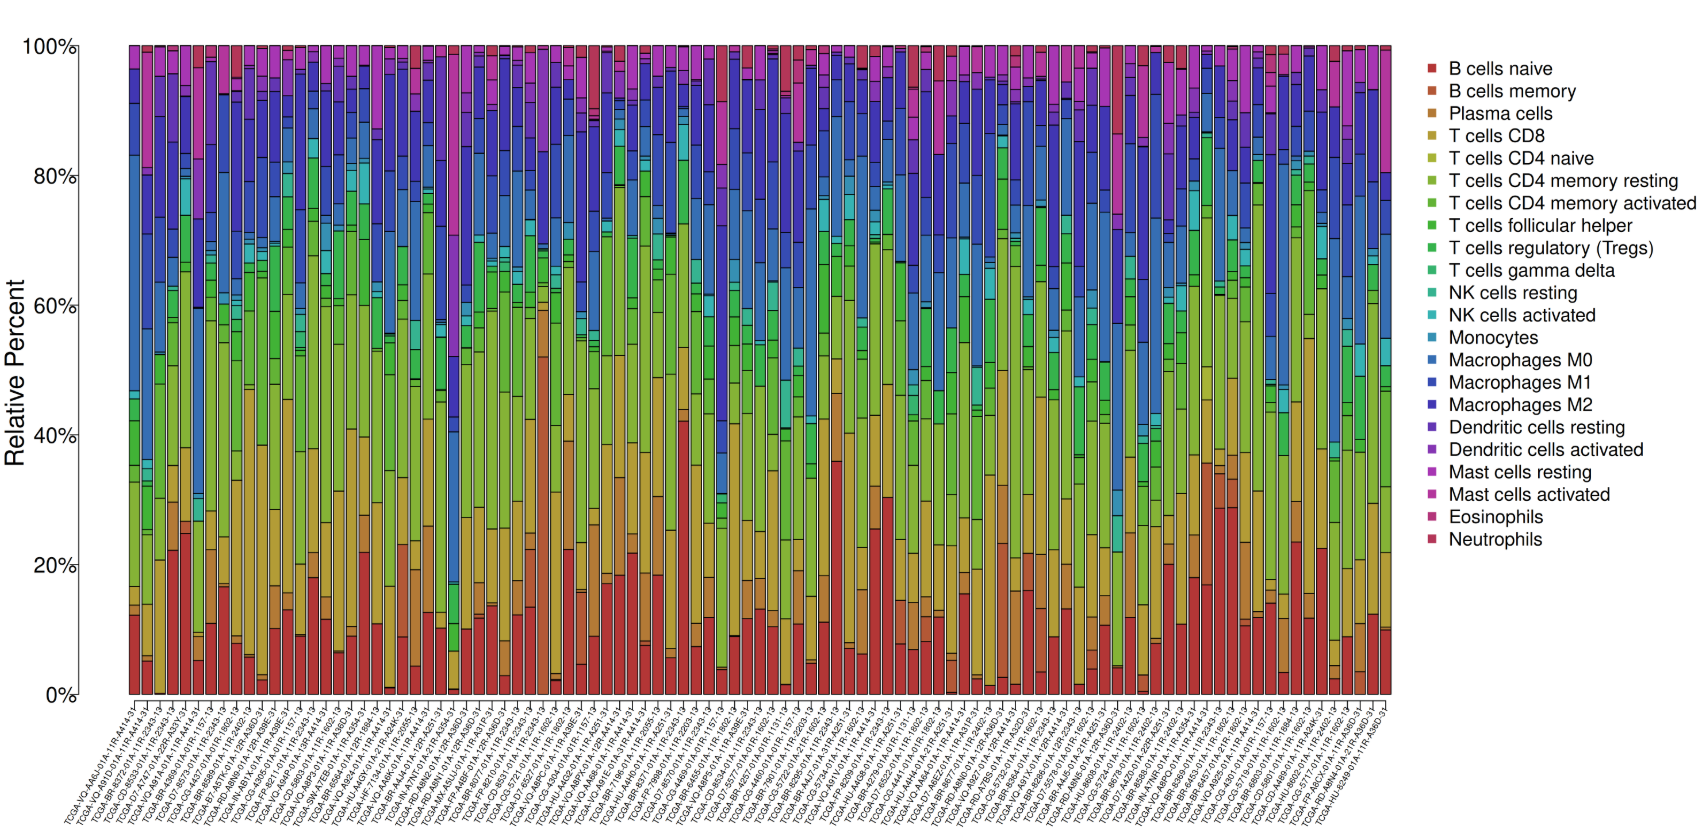
Percentage Bar Plot
Create stacked percentage bar plots showing relative proportions across groups
Grouped Bar Plot
Create grouped bar plots for multi-category data visualization
Differential Box Plot
Create box plots with statistical significance testing between groups
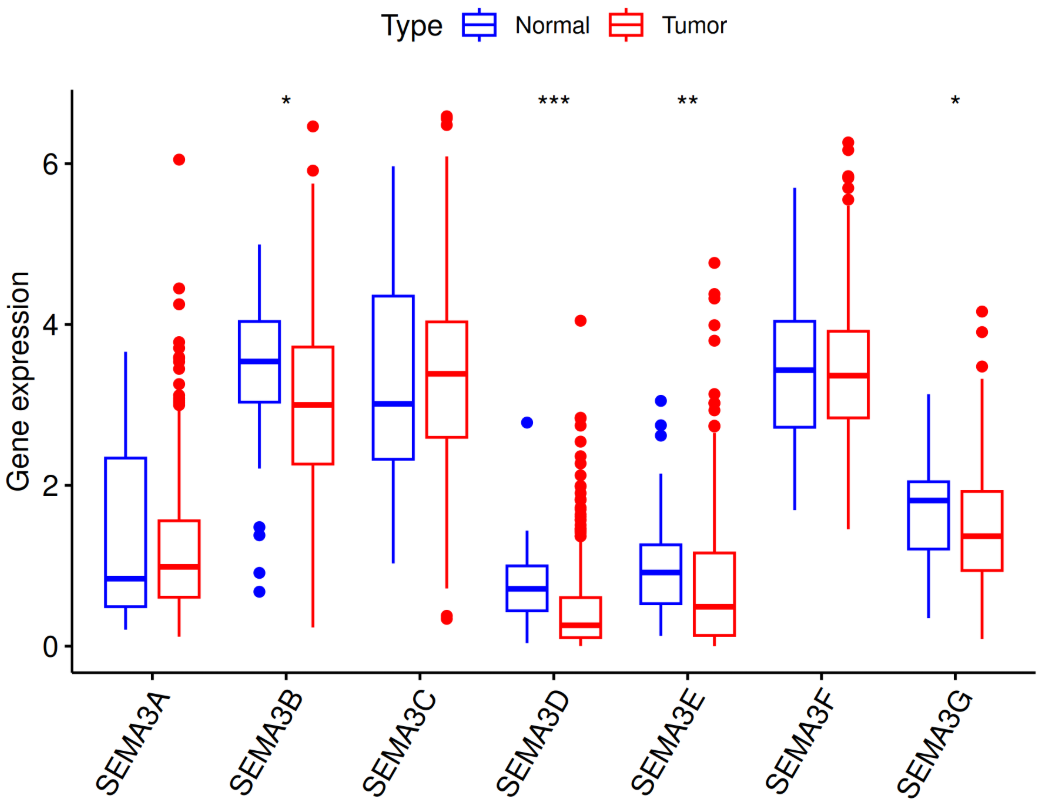
Multi-Group Box Plot
Create multi-gene multi-group box plots with statistical testing
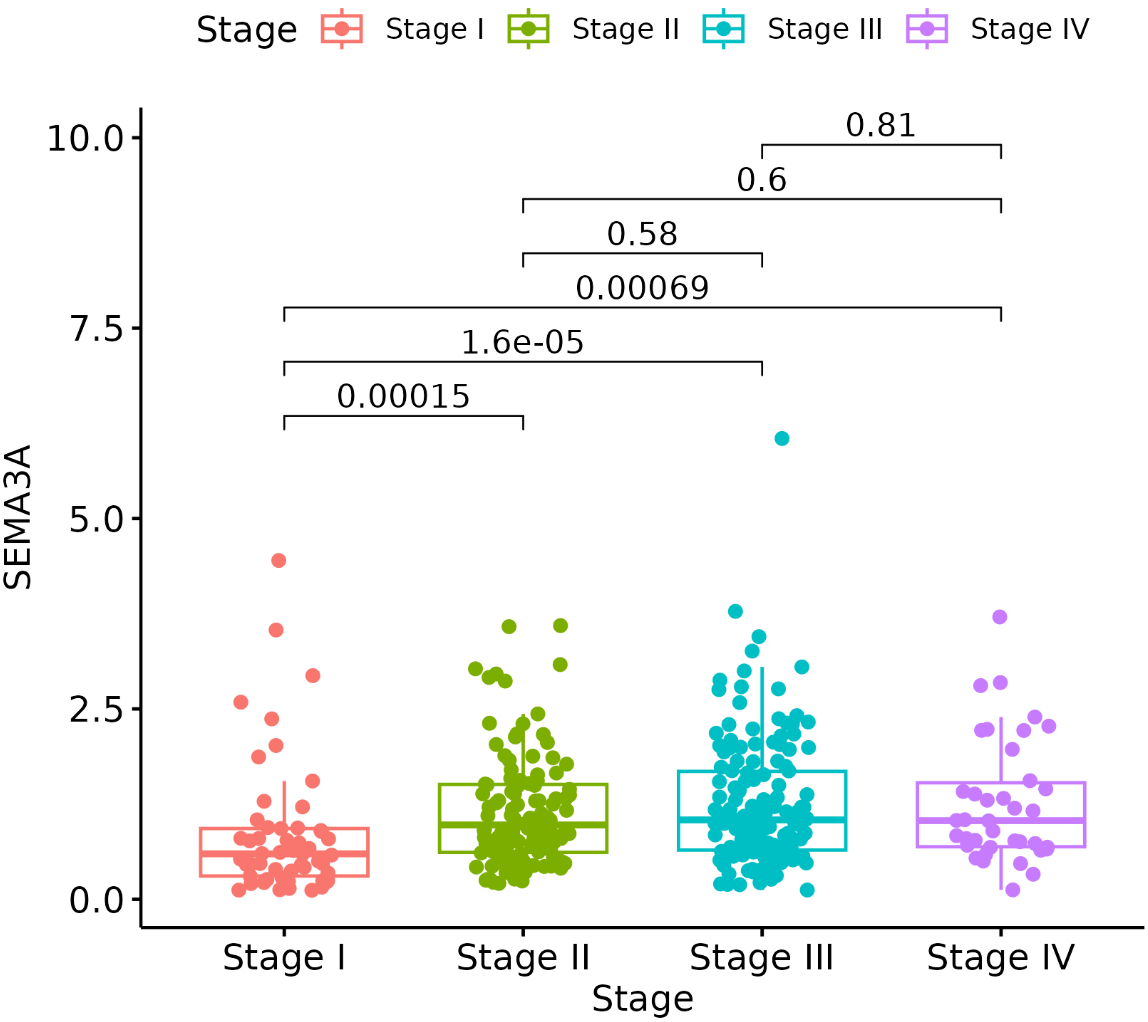
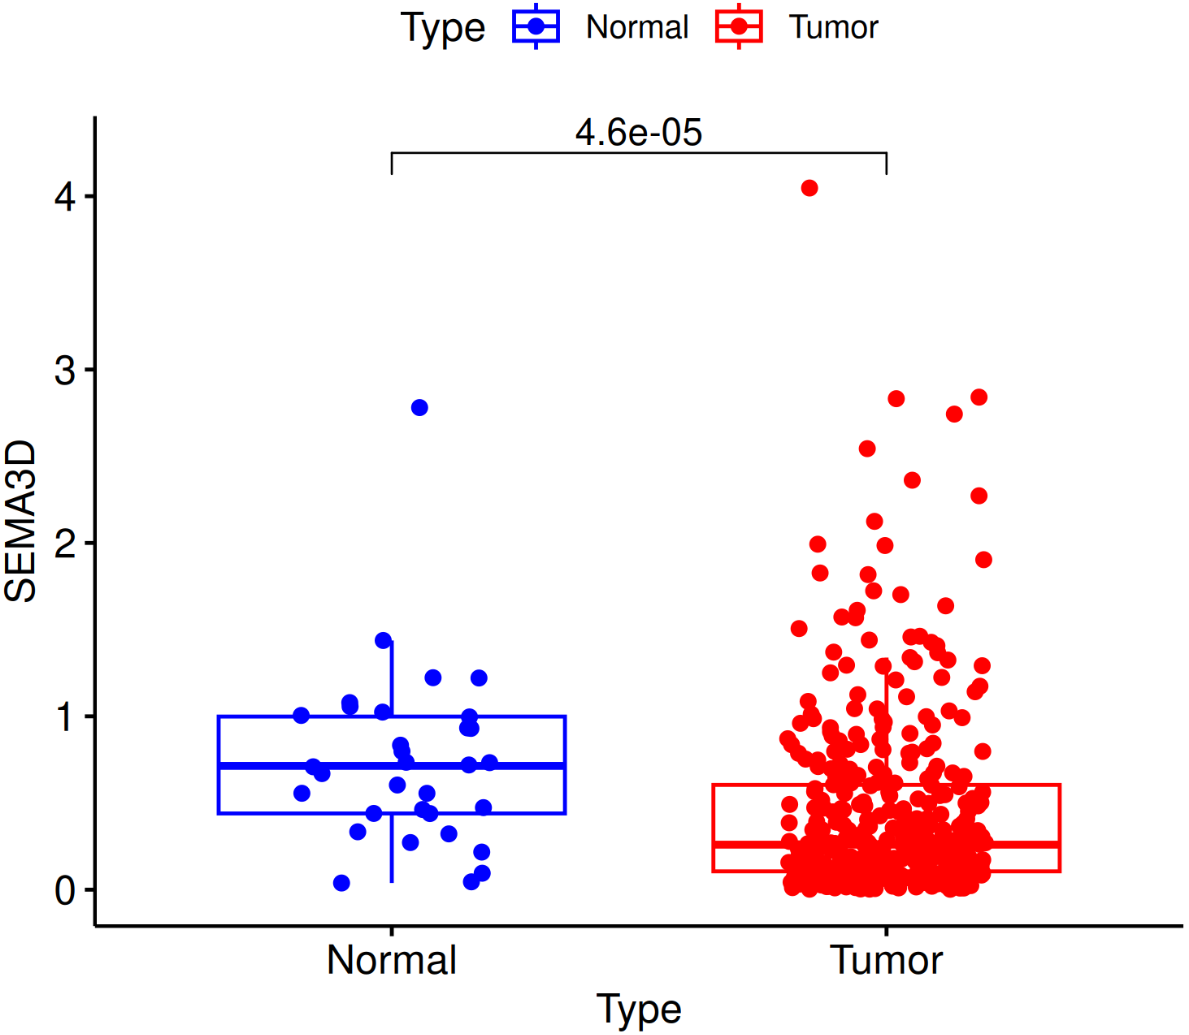
Clinical Box Plot
Clinical box plot with statistical tests for comparing gene expression across clinical groups
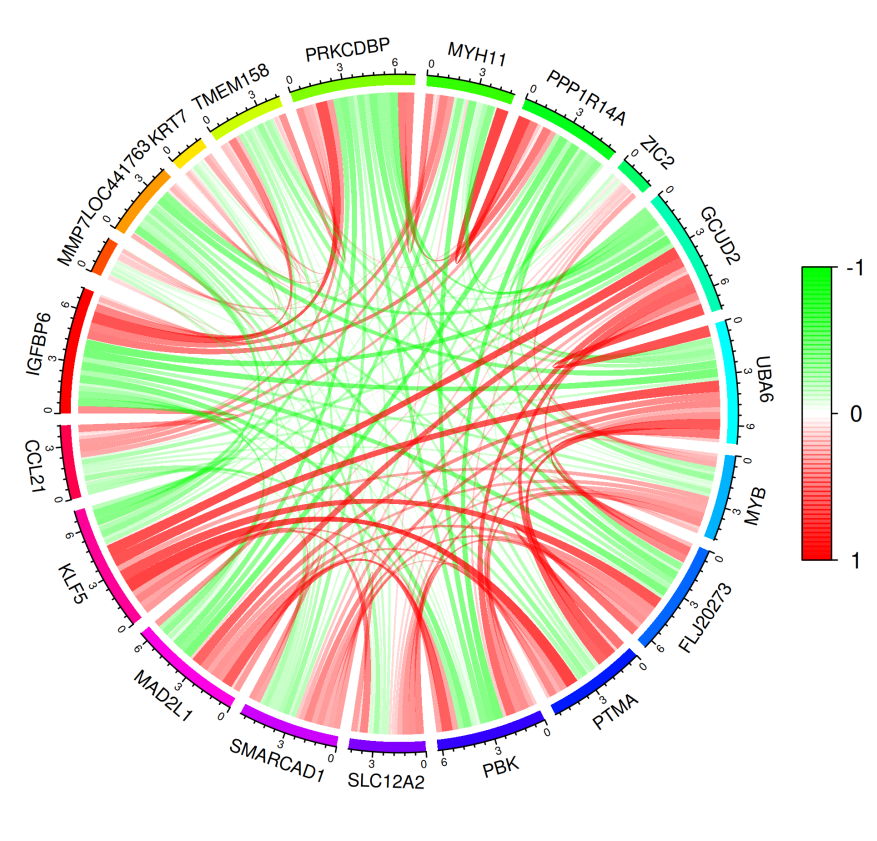
Circos Correlation Plot
Generate Circos correlation plot based on correlation matrix
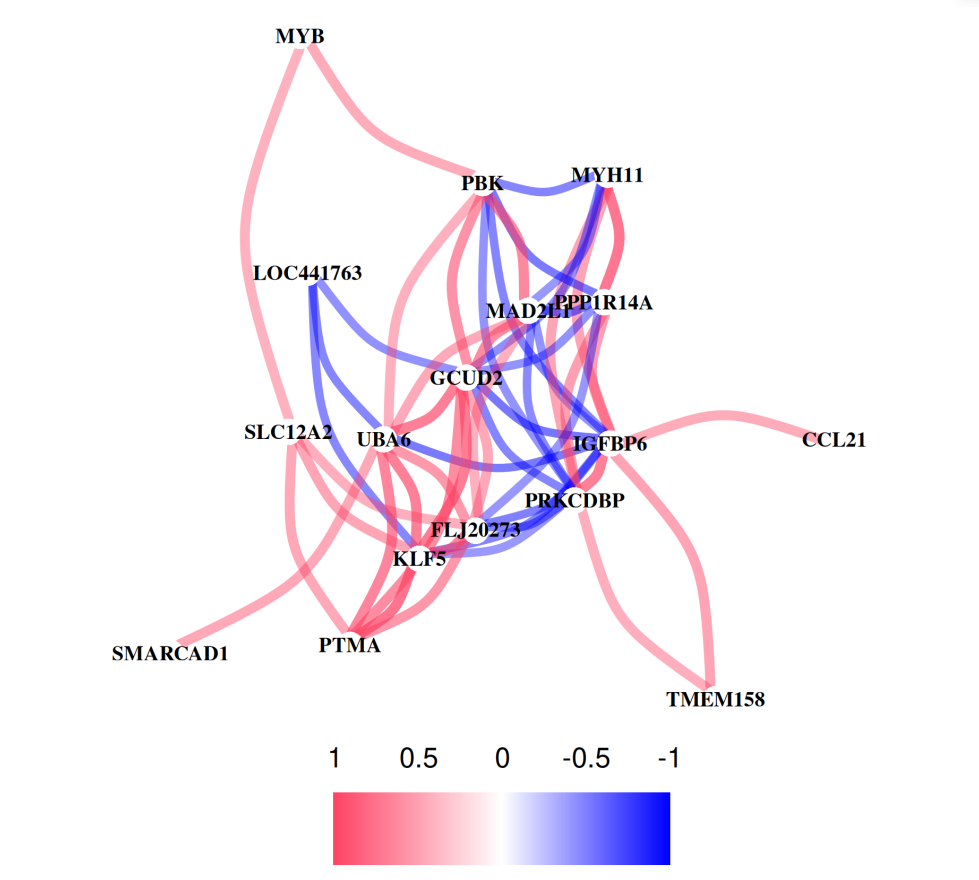
Correlation Network
Generate correlation network plot based on correlation matrix
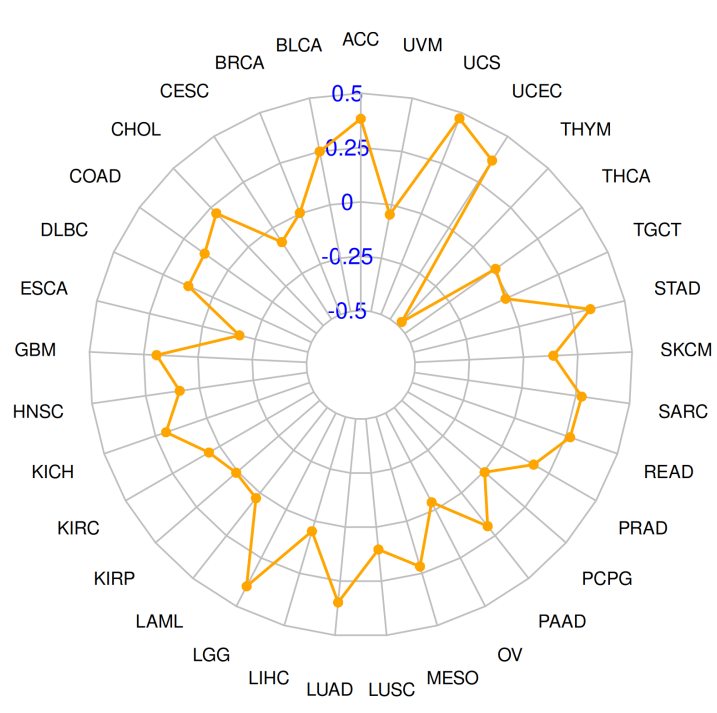
Radar Plot
Generate radar plot (spider plot)