Professional Bioinformatics Analysis Tools
Choose the right analysis tool to start your research
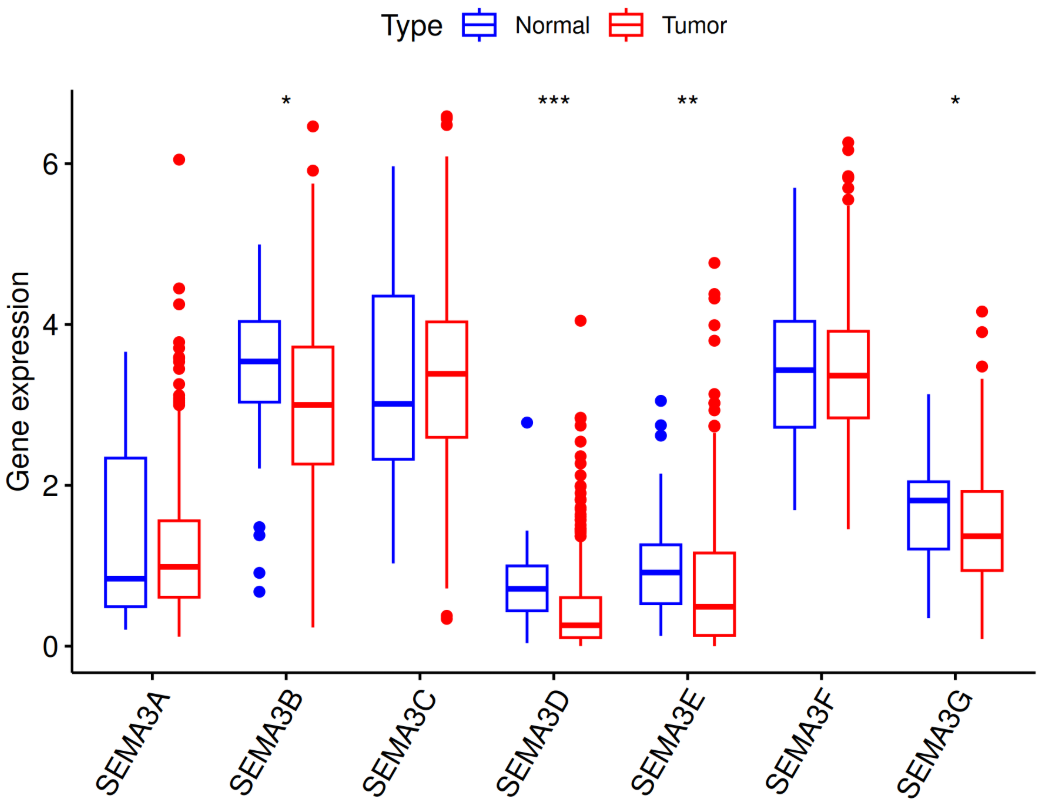
Multi-Group Box Plot
Create multi-gene multi-group box plots with statistical testing
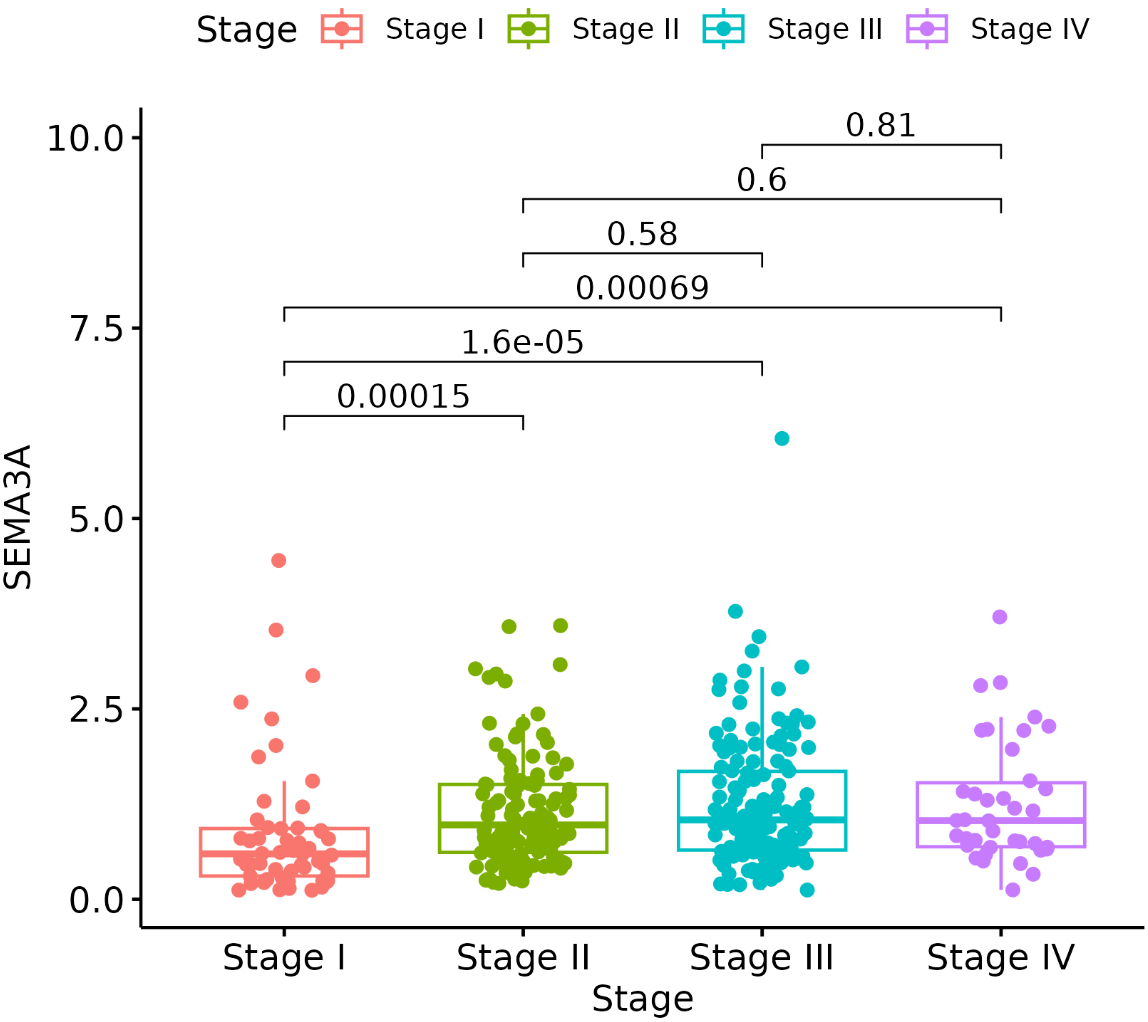
Clinical Box Plot
Clinical box plot with statistical tests for comparing gene expression across clinical groups
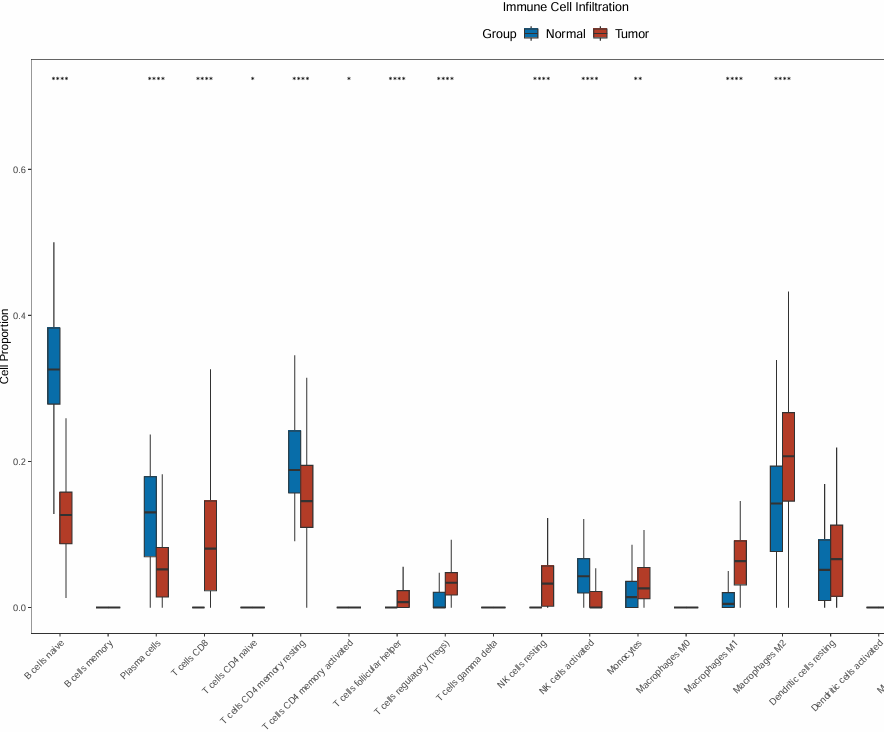
Immune Infiltration Analysis
Immune cell infiltration analysis using CIBERSORT algorithm
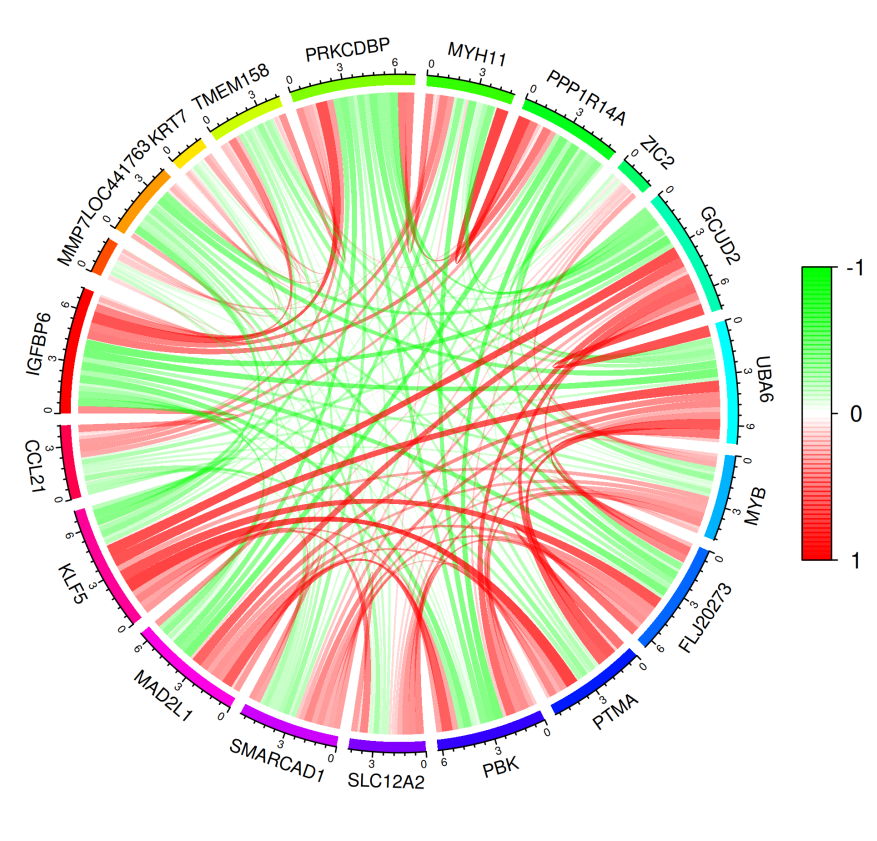
Circos Correlation Plot
Generate Circos correlation plot based on correlation matrix
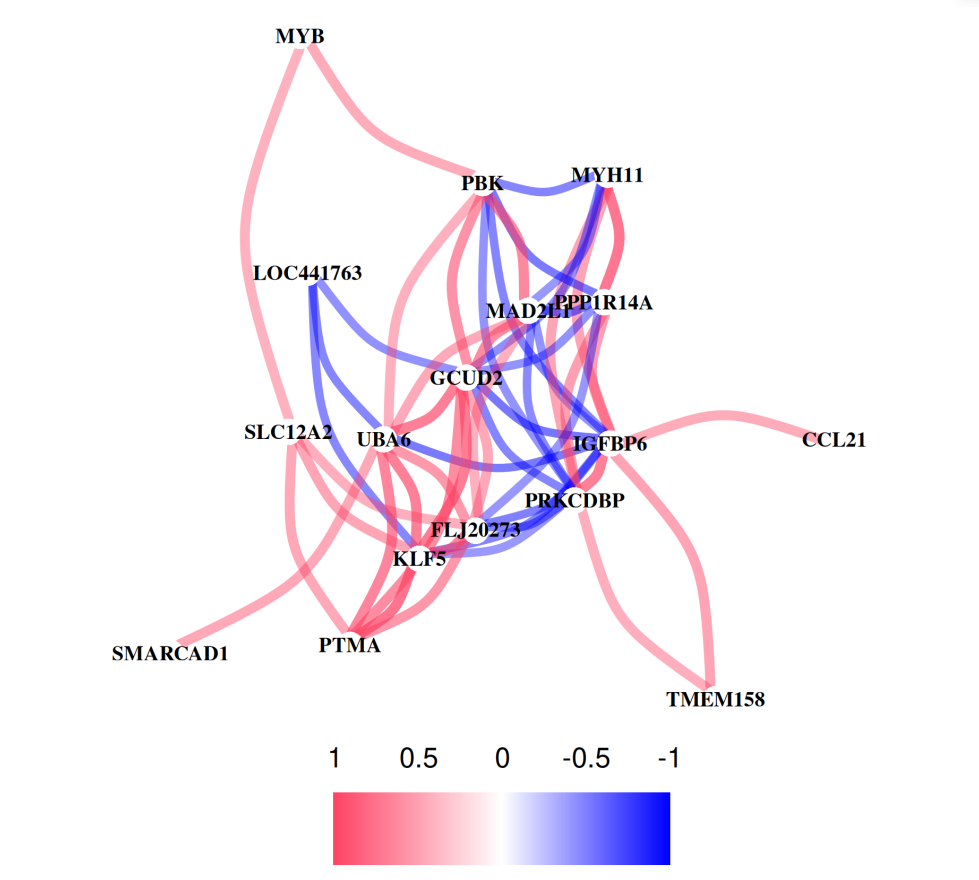
Correlation Network
Generate correlation network plot based on correlation matrix
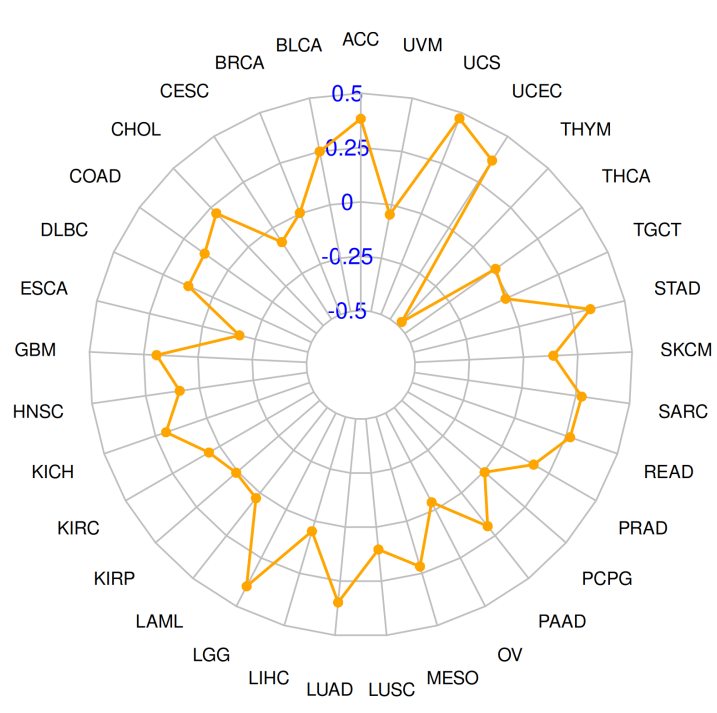
Radar Plot
Generate radar plot (spider plot)
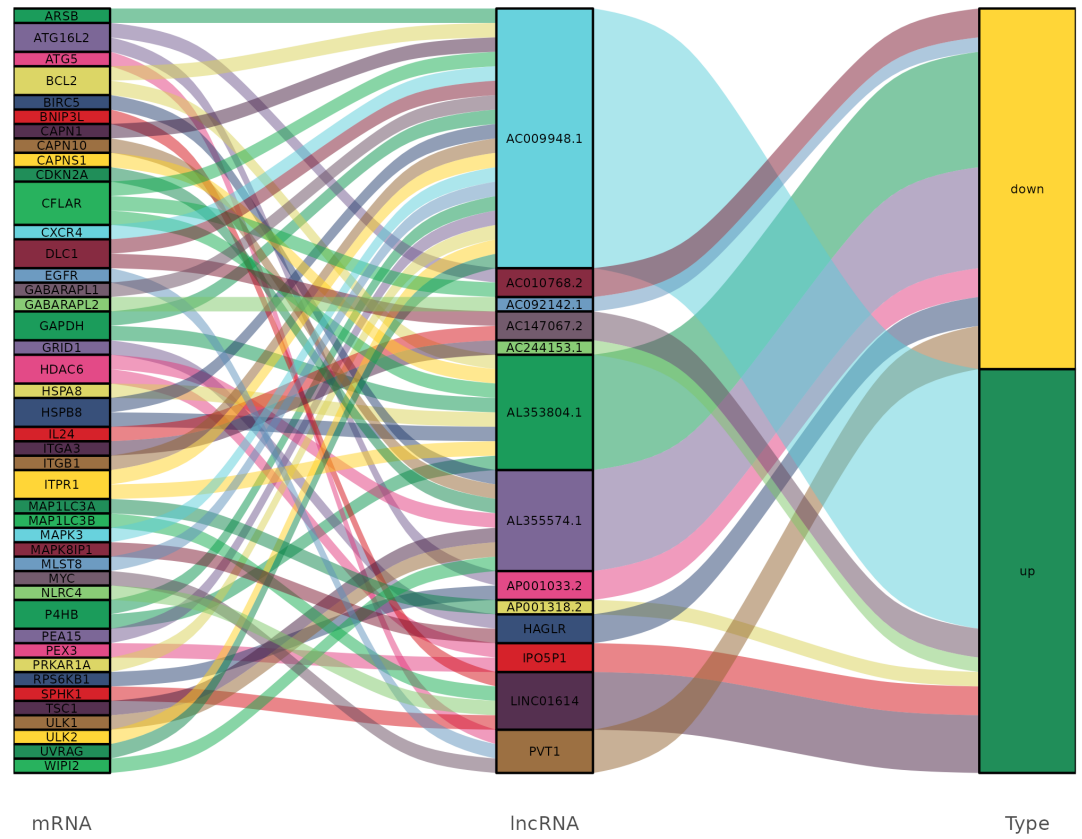
Alluvial Plot
Generate alluvial plot (Sankey diagram)
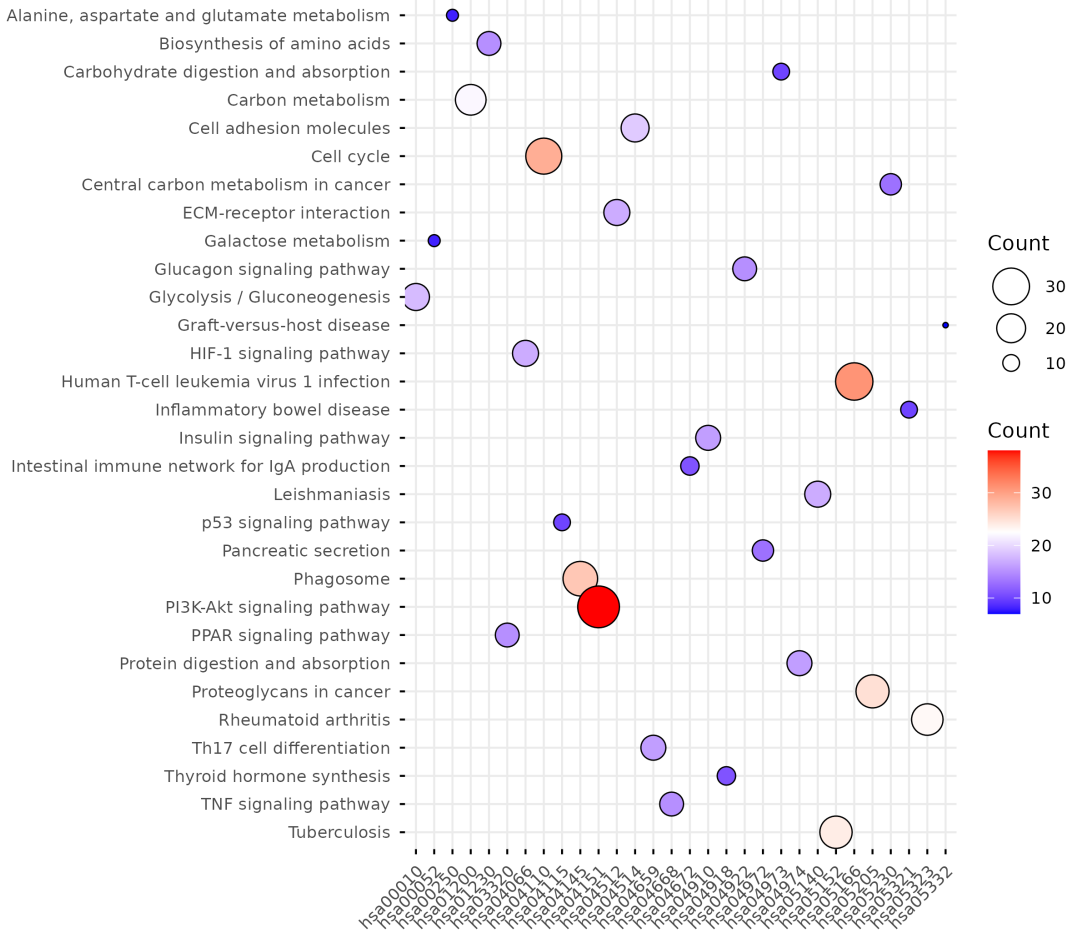
Balloon Plot
Create balloon plots to visualize matrix data with color gradient
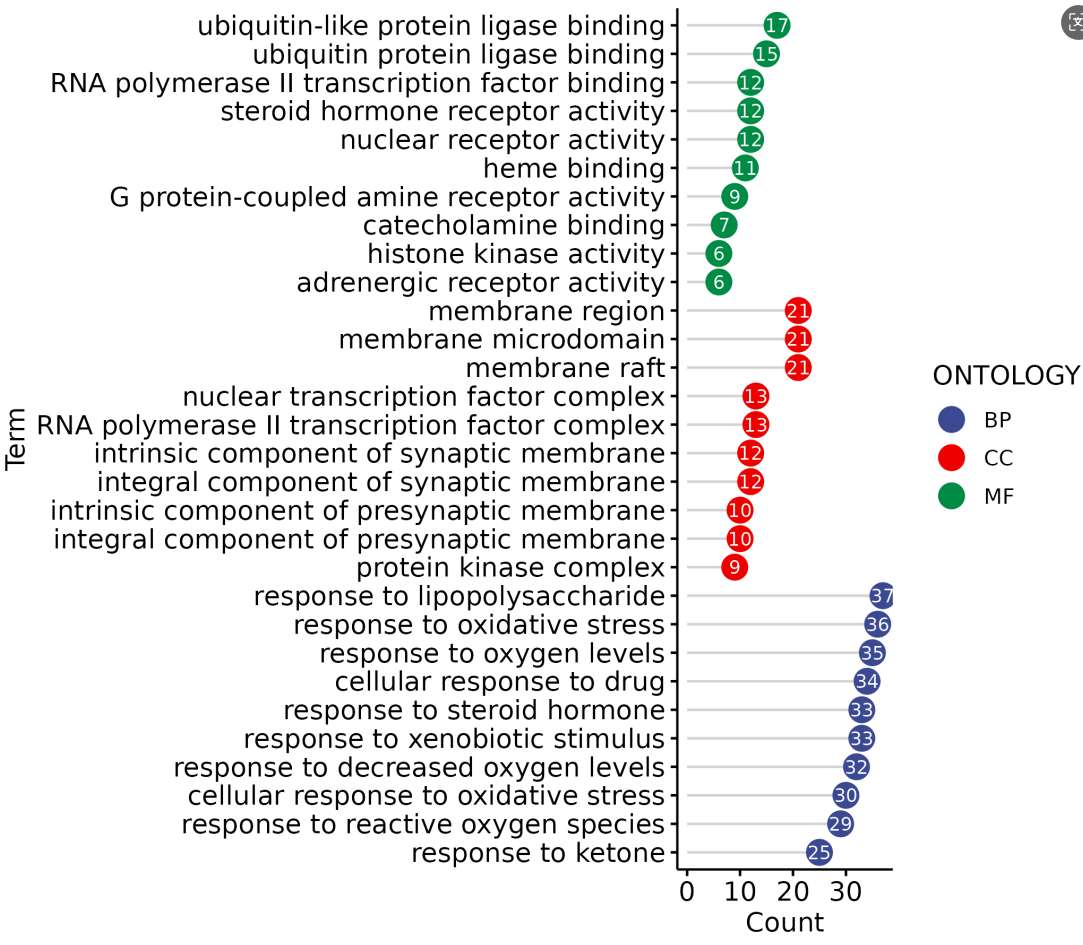
Lollipop Plot
Generate lollipop chart
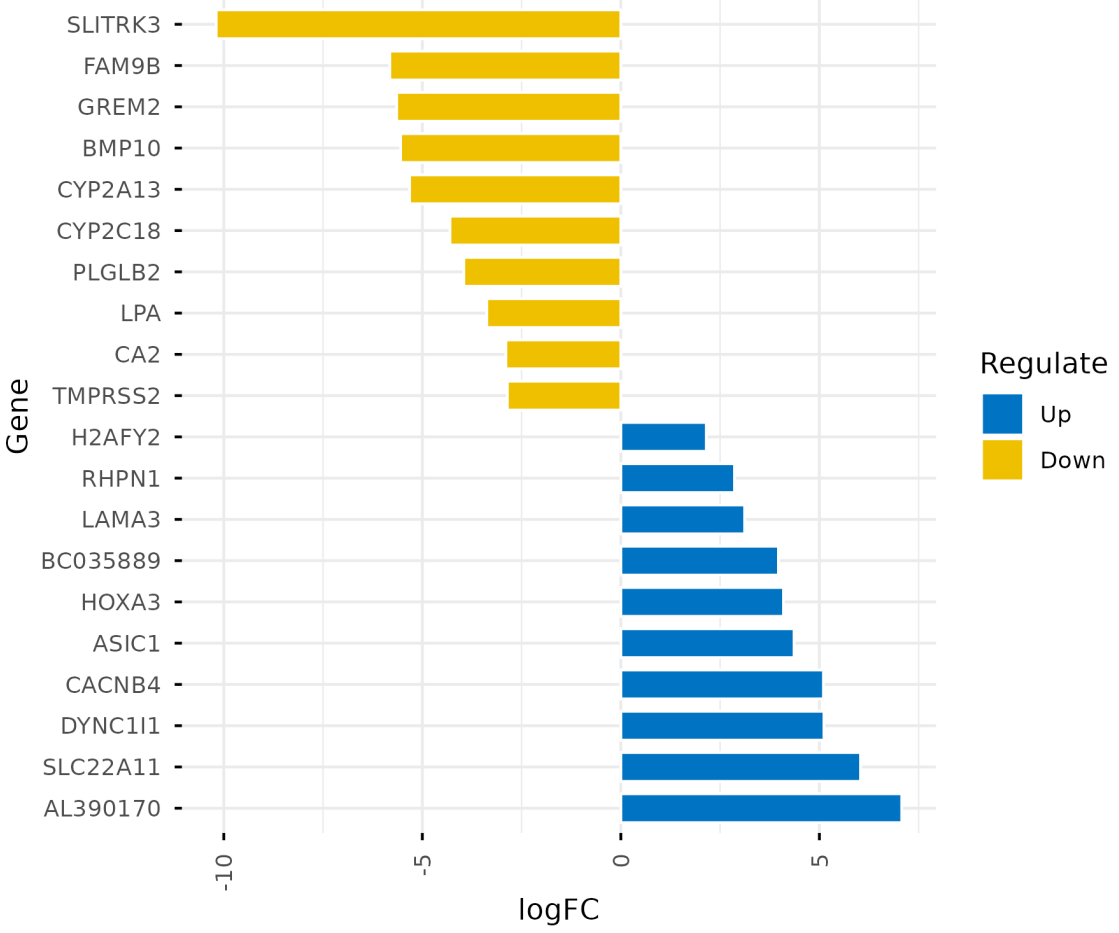
Deviation Plot
Visualize positive and negative deviations with bar plot
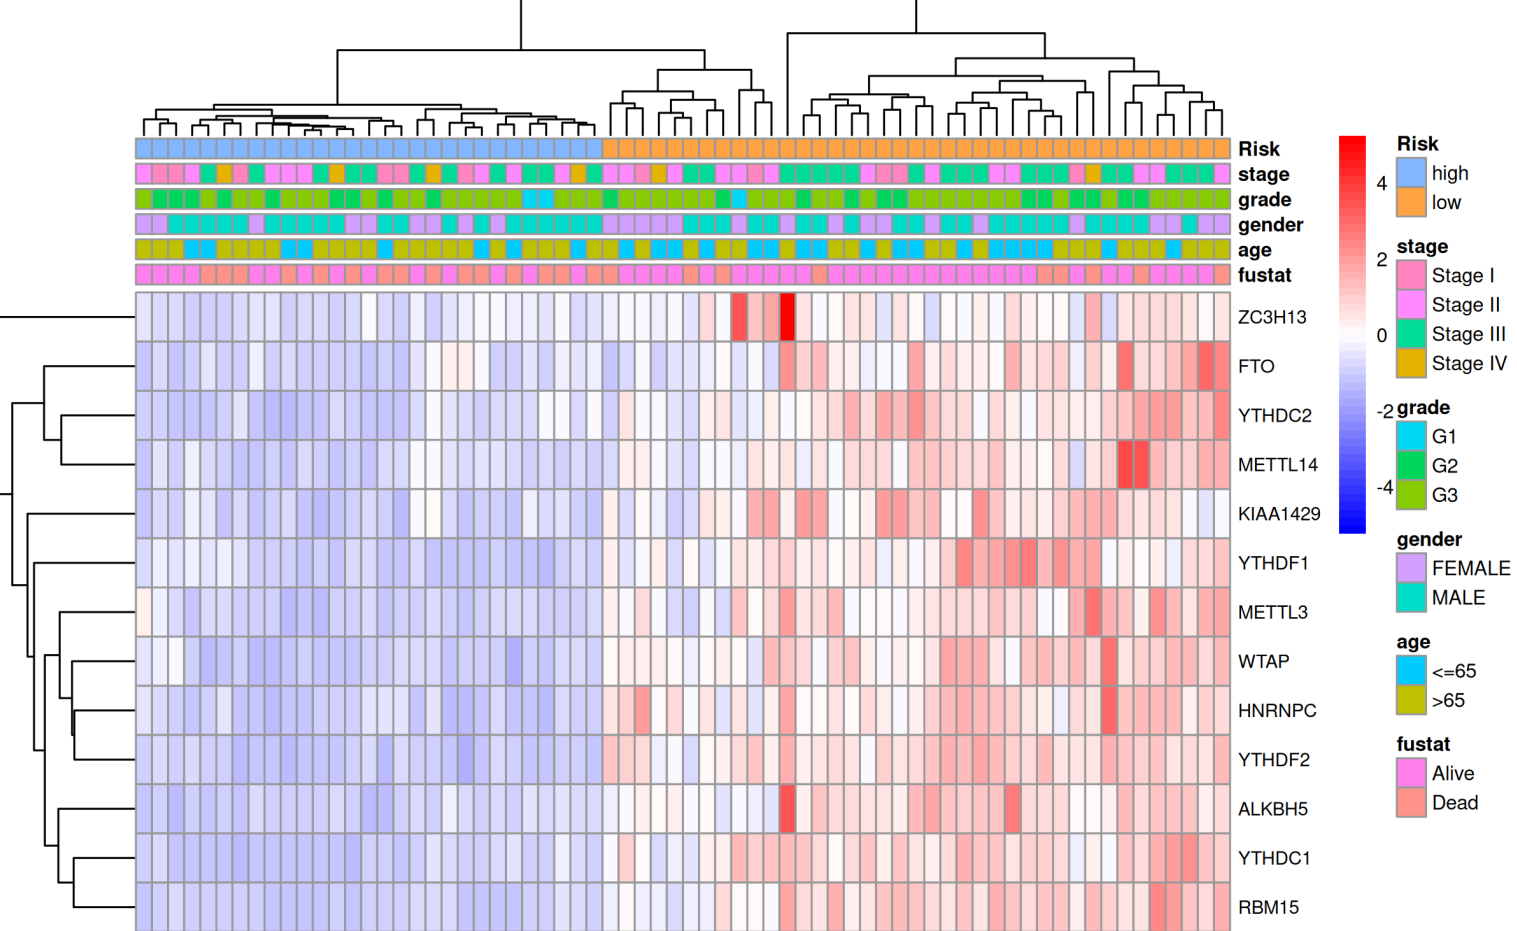
Clinical Heatmap
Generate heatmaps with clinical annotation

Correlation Plot
Generate correlation scatter plots between two genes